We are a web and mobile design, development, and digital marketing agency. Request a Quote
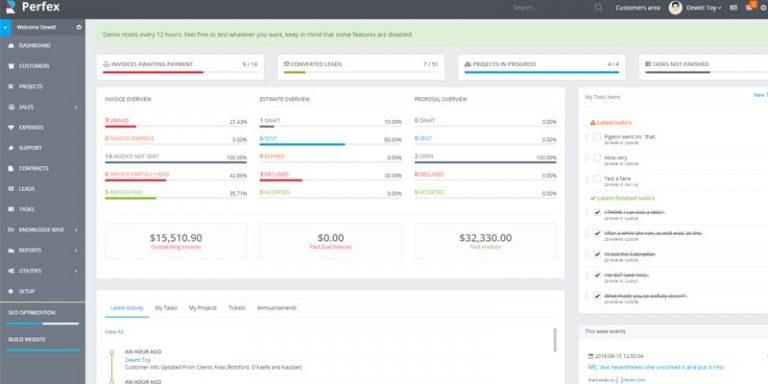
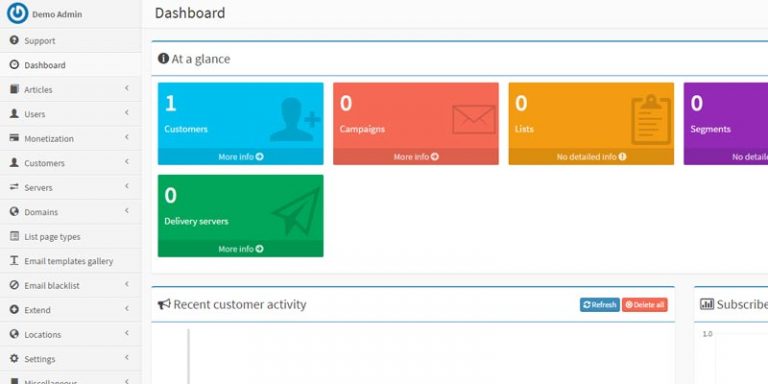
Visualizing the chart in web app dashboard or in simple website is great medium to turn your simple tabular data into interactive graph.

There are numerous chart plugin in market in form of jquery plugin and other javascript framework like mootools etc. but some only able to get designer and developer attention.
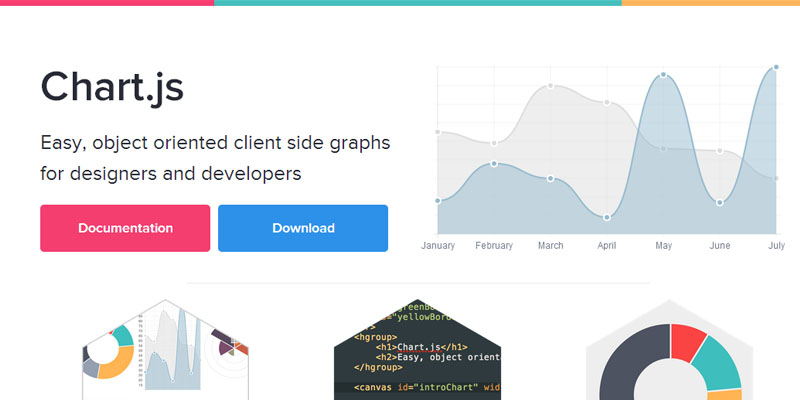
Chart.js is an independent client side object oriented javascript plugin that facilitate any web designer or developer to create awesome looking chart based on required data source.
Chart.js takes full advantage of html5 and css3 based elements to create different kind of charts.
The six inbuilt variant of chart.js are as:
- Line chart
- Bar chart
- Radar chart
- Pie chart
- Polar area chart
- Doughnut chart
Chart.js uses html5 based canvas element to create all above variety of charts, it is simple and light weighted (4.5k when minified and gzipped) and offers lots of customization options also it does supports modern web browsers.
[button color=”red” size=”small” link=”http://www.chartjs.org/” target=”blank” ]Demo / Download[/button]